


Google Analytics is a free web analytics service by Google that tracks and reports website traffic, currently as a platform inside the Google Marketing Platform brand.
Initial Google Analytics Settings
Before beginning these are few of the basic things that need to be set up.
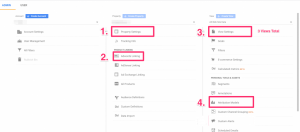
Property Settings >>> Check http vs https is correct, enable demographics & interest reports, hook up the search console (only if any SEO work is being taken on), turn on users metric
Adwords Linking >>> link this GA account to the Adwords account
View Settings >>> create a RAW view and create a SMART GOAL view, and… edit the view names to contain (<client name>), set currency to their local, exclude bots & spiders on all views EXCEPT FOR the Raw view, turn site search tracking on
POSSIBLY: sort their URL parameters here… optional (and longer) task which strips out any appends to URLs you may use for tracking purposes.
Attribution Model >>> set main view to time decay with half-life of 7 days
Overview & Sidebar Menu
Having done the basic setup one can now move on to using Google analytics. On opening up, you will see an overview like this.
In this article we will go through all the menu items on the left sidebar.
Home
When you click on home this screen appears:
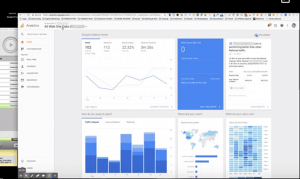
The homepage is a dashboard. It displays the bounce rate, last 7 days data and users etc. which is very helpful in SEO. It tells you the time of the day that the site is being visited most and the type of devices being used to visit it.
Sessions – The Sessions column shows the sum of all the interactions on your website that occurred within a particular timeframe.
Avg. Session Duration – The Average Session Duration column shows the average duration of all the sessions that took place on your website within a particular timeframe.
Bounce Rate – The Bounce Rate column shows the percentage of users who have left your website at some point, that is, who have “bounced” from your website.
Goal Conversion Rate – The Goal Conversion Rate column shows the sum of the overall conversion rate on your website.
Customization in Google Analytics
After the Home screen you can see the ‘Customization’ option, which has four parts, in this part you can see any custom dashboards that you have made. These dashboards are easy to share with other people and it is important to note that they are owned here by the user of the google account and not the website itself.
After dashboards, we have ‘custom reports’, where if you want to customize any reports of data you can do that.
After that, you have the option of ‘saved reports’ where you can save any reports you want to easily view later.
At the end, there is ‘custom alerts’ so for example if you want to be alerted by email if the bounce rate shoots up too much, this is where you can set that up.
Real-Time Reports in Google Analytics
After customization is “Real-time” which is basically a real-time overview of the site activity. It can be very useful for testing or to give you an insight into the site traffic and users at any given time. In the Real-Time Overview, you can see the exact number of active users on your website, how many of your website pages are being viewed per minute and per second, the top keywords your active users are using, and a list of your top active pages, along with the number of active users per each of those pages.
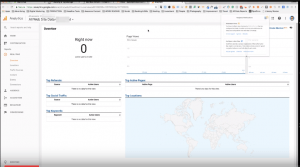
It can give you information about the ‘location’, ‘traffic sources’, ‘content’, any site ‘events’ and ‘conversations’ going on your website.
Audience Reports
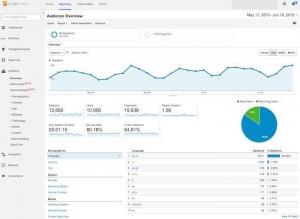
The Audience reports provide you with information about the visitors on your website. In the Audience Overview tab, you can see how many sessions there are on your website over a particular time period. You can switch to see the hourly, daily, weekly and monthly reports.
Under the graph showing you the number of your sessions for a particular time period, you will be provided with additional information about your audience, including the number of users, the number of page views, and the number of pages per session, average session duration, bounce rate, and the percentage of new sessions. Also, you will get a pie chart showing you the ratio of new visitors to returning visitors.
Under all of those metrics, you can see where your website visitors are coming from (country, city) and what language they are speaking, as well as what browsers, service providers and operating systems they are using when visiting your website.
Apart from the Overview tab in Audience reports, you will find tabs that provide some additional information as well.
The ‘Demographics’ tab shows you the age and gender of your website visitors. The ‘Interests’ tab shows you what the interests of your website visitors are, including areas such as technology, movies, travel, news and much more. The ‘Geo’ tab shows you the locations of your audience and the languages they speak. The ‘Behavior’ tab shows the behavior of your audience, that is, their interaction with your website (their engagement on your website, whether they are first-time or returning visitors, how often they visit your site).
The ‘Technology’ and ‘Mobile’ tabs show you what platform your audience is using when visiting your website (browsers, operating systems, networks, devices). You can use the Custom tab to add custom variables that will help you learn more about your audience over a particular date range.
The ‘Benchmarking’ tab allows you to compare your date with that of your competition, so that you can gain insights into industry trends and target your audience better. However, you can use benchmarking to compare data only with companies that actually share their data. If you use benchmarking, you can choose from three different reports: Channels, Location and Devices.
The ‘Users Flow’ tab provides you with a graph that shows your audience’s journey through your site, that is, on which page they landed, which pages they viewed and at what point they left your site.
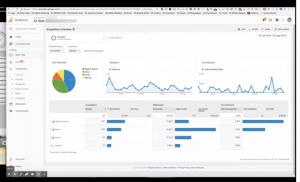
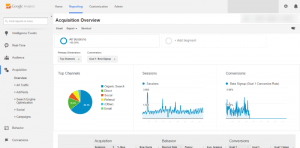
Acquisition Reports
The ‘Acquisition reports’ will show you how your website visitors actually came to your site. It will give you a summary of your direct, organic, referral and social (coming from social media) traffic, as well as traffic coming from email. If you use AdWords, you can see how your PPC campaigns are performing. All you need to do is go to the Admin tab and link your AdWords account to your Google Analytics account.
The ‘Search Engine Optimization’ tab in the Acquisition reports shows you which keywords your website visitors searched for to come to your website. However, in order to use this tab, you need to have a Google Webmaster account and link it to your Google Analytics account.
Behaviour Reports
Behavior reports will show you how your website visitors are interacting with your website, so that you can know how your content is actually doing with the audience. You can view important reports in the following tabs: Behavior Flow, showing you the pages your visitors are navigating, from the landing to the exit page, Experiments, allowing you to conduct A/B testing to see which of your landing pages are performing best, so that you can optimize your conversion goals and In-Page Analytics, allowing you to view your web pages along with your Google Analytics data. In order to use In-Page Analytics reports, you need to install the Page Analytics extension for Google Chrome, so that you can have access to real-time data.
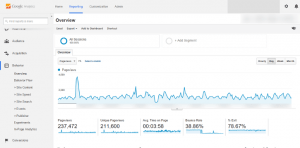
In the Behavior Flow reports, you will find additional reports that can be of great use, including Site Content, Site Speed, Site Search, Events and Publisher reports. The Site Content reports show the content on your site that is performing best, that is, your top pages, your top landing pages and top exit pages. The Site Speed reports show you how fast your website actually is, along with the pages that may be slowing it down, and it provides you with suggestions on how to speed up your website.
The Site Search reports show you the keywords your website visitors are using on your site, but you need to set up site search in order to be able to view those reports. The Events reports let you track the specific actions of your website visitors, such as downloading your eBook, for instance, or clicking on a particular link. In order to use the Publisher reports, you need to have an AdSense account and link it to your Google Analytics account. If you do that, you can view your AdSense publisher data in the Publisher reports.
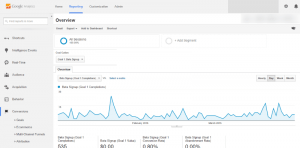
Conversions
The Conversions reports will show you the actions your website visitors have taken before they actually converted. These reports will show you their entire path towards conversion, as well as how many conversions have taken place on your website.
You have four different reports in the Conversions tab: Goals, Ecommerce, Multi-Channel Funnels and Attribution. The Goals reports allow you to create and track your conversions, that is, create and track goals that lead to conversions. The Ecommerce reports will give you an insight into the activity of your customers (if you have an ecommerce store on your website, of course).
The Multi-Channel Funnels reports will show you how your marketing channels are performing in order to lead to conversions. The Attribution reports let you assign credit for conversions to specific points on the conversion journey.
Here’s a quick video summary of this blog: